10 Jul Conditions of Regression Models
Tests and statistical models all have conditions to be used.
In this article, we describe the conditions of regression models, as well as how they are checked by pvalue.io
In this article, we describe the conditions of regression models, as well as how they are checked by pvalue.io
In an attempt to make it simpler, we will call Y the response variable that we want to explain by X factors. (Use your distant memories: Y = aX +b)
If, for example, we want to explain the probability of being born male based on diet, Y is the sex, and X is the diet).
If, for example, we want to explain the probability of being born male based on diet, Y is the sex, and X is the diet).
Multicolinearity
The X variables must not be dependent on each other. In the presence of multicollinearity, the estimation of coefficients, standard deviation and p-values are incorrect. It is therefore crucial to detect it by using a more or less sophisticated method.
For this purpose, the software uses an iterative algorithm based on the “Variance Inflation Factor” (VIF).
As long as there is any variable with a VIF greater than 5, the user is informed of the presence of multicollinearity and is prompted to delete this variable.
Linear Regression
Conditions of the linear regression:
- A linear relationship between the variable Y and each of the numerical variables X. Pvalue.io displays the curve that best explains the relationship between the two variables, while adjusting on the other covariates (this type of curve is called a spline).
When this condition is not met, pvalue.io will suggest to transform X : by selecting positions on the curve, using thresholds given in the literature, or by tercile, quartile and quintile.
For instance, in the figure below, the curve is linear between 25 and 45. Before 25, there are very few observations, so the confidence interval is very wide; and after 45, the line changes slope and becomes almost horizontal. If there are no arguments for another type of splitting, then point 45 on the curve should be selected, which would transform the numerical variable into a 2-class categorical variable: ≤45 >45.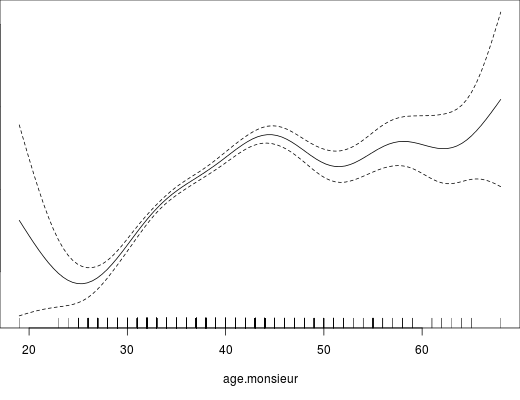
- A normality of the distribution of residuals: this normality is checked by an algorithm that considers that a distribution close to the Gaussian distribution is sufficient to carry out a linear regression (we do not use the Kolmogorov-Smirnov test or the Shapiro-Wilk test). Pvalue.io checks that the mean is about equal to the median and that most of its values are between the 25th and 75th percentile. If normality is not met, pvalue.io performs a bootstrap.
- A sufficient number of observations: At least 10 observations for each variable X introduced into the model; if X is categorical, and N is the number of different categories, this accounts for N-1 additional variables. The user is therefore invited to reduce the number of explanatory variables if the number of observations is insufficient.
- The homoskedaticy of the residuals: pvalue.io checks that the variance of the residuals is more or less constant according to the predicted value.
- Independence of residuals: this condition cannot be verified automatically. It is generally accepted that it is met in the absence of repeated measures over time, if the other application conditions are met
In the presence of heteroskedasticity or an analysis based on repeated measures over time, statistical expertise is necessary.
Logistic Regression
Conditions of the logistic regression:
- A linear relationship between the logit (\(\ln \frac{p}{1-p}\)) of variable Y and all quantitative variables X; pvalue.io follows the same approach as for linear regression.
- A sufficient number of observations: At least 10 observations for which Y = 0 and Y = 1 for each variable X introduced into the model; if X is categorical, and N is the number of different categories, this accounts for N-1 additional variables. It is quite possible and even frequent that you do not have enough observations, despite a large number. This is especially the case if you have few observations for which Y = 0 or Y = 1, or if you have categorical variables with a large number of classes.The user is therefore requested to reduce the number of explanatory variables if the number of observations is not sufficient.
Survival analysis: Cox model
Conditions of the Cox Model :
- A linear relationship between the logarithm of instantaneous risk and all quantitative variables X; pvalue.io follows the same approach as for linear and logistic regressions: this is the log-linearity hypothesis.
- That the Hazard Ratio of the variable does not change over time: this is the proportional risk assumption
- A sufficient number of observations: At least 10 observations for which Y = 0 and Y = 1 for each variable X introduced into the model; if X is categorical, and N is the number of different categories, this accounts for N-1 additional variables. The user is therefore requested to reduce the number of explanatory variables if the number of observations is not sufficient.
No Comments