03 Jul Transformation of numerical variables
- In statistical modeling, it is often necessary to group the values the numerical variables to create classes in order to meet the conditions of the model.
- If we have no a priori idea about the appropriate grouping, it is preferable to base ourselves on the splines representing the relationship between the response variable and the explanatory variable.
For example, if we want to explain the probability of being born male as a function of diet, Y is the male sex, and X is the diet)
Why transform?
A number of assumptions must be met in order to be able to use a statistical model (allowing multivariable analysis).
In particular, there must be a linear relationship between the variable Y (if it is a linear regression, or a transformation of Y if it is another type of model) and all numerical variables X.
When this assumption is not met, one solution is to transform the numerical variable X (e. g. weight 67kg, 78kg, etc.) into a categorical variable (e. g. weight 60-70kg, 70-80kg, etc.).
How to transform?
pvalue.io offers 3 different ways to transform a variable:
- Using data from the literature
- Using splines
- Into quantiles
Using data from the literature
When thresholds are commonly accepted or used in medical articles (e. g. BMI), you can use these thresholds themselves.
Using splines
To simplify, a spline is a mathematical function of the relationship between Y and X. This relationship can be visualized graphically, with confidence intervals. In general, these confidence intervals are spread at the extremes of the x-axis because clinical parameters are often normally distributed, so there are few individuals with values close to the extremes.
If the graphical representation of a spline is a straight line, then the relationship is linear between Y and X and therefore the linearity assumption is met.
If the spline is a curve, two scenarios:
- It is possible to draw a line within the confidence interval, or slightly outside it; in this case, we can consider that the linearity assumption is met.
- It is clearly not possible to draw a line; the curve is divided into several increasing and decreasing parts. In this case, it will be necessary to transform the variable.
Caution, however, if the bounds of the confidence interval are wide, it is difficult to conclude, as many lines could be drawn within this interval.
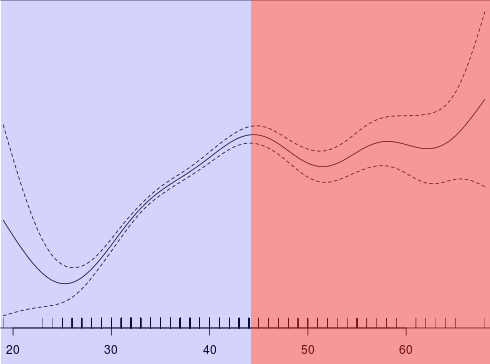
Where to split?
If the curve can be divided into several parts (e. g. an increasing part, then a decreasing part and then a horizontal part), the optimal position to split this curve is the junction between two curve parts.
In the figure below, the optimal position is around 45; the curve is increasing before 45 and horizontal after 45; the confidence interval is too wide before 30 to be able to say that the curve is decreasing.
On pvalue.io, simply click on the curve to automatically create the corresponding classes for explanatory analyses, or to create the appropriate transformation for predictive analyses. You can then modify them (for example, by rounding to the nearest integer or tens). Most of the time one or two clicks are enough.
Into quantiles
Commonly, patients can be grouped into quantiles (terciles, quartiles, quintiles).
If patients are ordered according to the value of the studied variable (the patient with the lowest value is first, the one with the highest value last), the quantiles classify your ordered patients into 3, 4 and 5 groups, respectively, of the same size.
For instance, if I have 66 patients and I want to create terciles of age, I will have a group of 22 patients between the youngest and 22nd youngest, a group of 22 patients between the 23rd and 44th, and 22 patients between the 45th and 66th.
No Comments